Figure 1
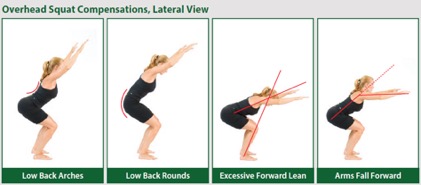
Overhead squat compensations (The Fitness Trainer Academy, 2015)
Kinematics Comparison of Squat (2D vs 3D analysis) for Remote LEARNING – PILOT STUDY
Department of Kinesiology, San Francisco State University
Submitted February 2022; Accepted in final form March 2022
Huang and Bagesteiro. Bodyweight squats are a common exercise in athletic training and rehabilitation due to their biomechanical and neuromuscular similarities to fundamental movements in a variety of sports and their requirements of coordination of major joints and numerous muscle groups (Schoenfeld, 2010). They are essential for kinesiology students, whose future careers often include athletic training and rehabilitation, to learn how to analyze the kinematics of a squat. While 3D movement analysis is considered the gold standard for motion capture (Chung & Ng, 2012), 2D digital video analysis is more commonly chosen in education environments to provide hands-on experience. However, few studies have investigated the differences between 2D and 3D analysis of squats (Escamilla et al., 2001; Krause et al., 2015; Schmitz et al., 2015). Therefore, the current study aims to compare 2D and 3D measurements of narrow-stance squats while enhancing learning by engaging students with hands-on experience using free, open-source software. Fifteen healthy adults (nine females, six males, 26.93 ± 9.04 years old) participated in this study. Following proper COVID safety guidelines, 2D analyses were performed by undergraduate students at home while 3D analyses were performed using a motion capture system in the laboratory. Lower extremity joint angles and displacements were calculated using 2D and 3D methods. Statistical significances were found when comparing the differences between both measurements except for hip flexion. Nonetheless, the resulting angular and linear measurements from both 2D and 3D analyses aligned with previous research, suggesting that 2D digital video analysis is a viable option for educational purposes despite the significant differences.
Key Words: lower extremity joints, linear and angular displacements.
Undergraduate-level biomechanics is a core course in kinesiology curriculum that introduces the application of physics principles to the human body (Catena & Carbonneau, 2018). Courses during the COVID19 pandemic had to be moved to online learning, where most lab activities were limited to demonstrations. However, previous studies found that passively watching demonstrations was insufficient for most students to understand mechanical concepts (Crouch et al., 2004; Julian, 1995; Roth et al., 1997). Despite the instructor’s efforts, students understood very little about the underlying concepts behind the demonstration (Roth et al., 1997), and observations failed to improve the rates of correct responses compared to no demonstration (Crouch et al., 2004). Various reasons contributed to this phenomenon, including students’ inability to understand the important content, inaccurate connection to previous concepts and superficially similar demonstrations, low engagement, and lack of opportunity to test their ideas (Roth et al., 1997). As a result, students watching demonstrations might incorrectly interpret the phenomenon or even misunderstand observations that never occurred (Milner-Bolotin et al., 2007). On the other hand, predicting outcomes and discussing them were found to significantly improve students’ understanding (Crouch et al., 2004; Sokoloff & Thornton, 2004). Moreover, interactive lecture experiments, where students are involved in the data collection and analysis process and are responsible for discussion and solving related homework problems, were found to be greatly beneficial for students’ conceptual learning and test performance (Catena & Carbonneau, 2018; Milner-Bolotin et al., 2007). The hands-on experience is so valuable in promoting student learning outcomes that it is considered to be the center of scientific education (Brinson, 2015; Ma & Nickerson, 2006). Additionally, remote laboratory activities where students complete the experimental steps at their own pace and location can offer similar benefits to in-person hands-on laboratory activities (Brinson, 2015; Cooper, 2005; Ma & Nickerson, 2006).
Practical activities are an interactive and critical aspect of the learning process. They are essential to engage students and develop problem-solving and critical-thinking skills, as well as enhance student understanding of specific topics and associating them with theoretical concepts and application. More specifically, when studying human movement, it is important to exemplify these experiences with activities familiar to the students (e.g., walking, running squatting, and reaching).
Bodyweight squats are a common exercise in athletic training due to their biomechanical and neuromuscular similarities to fundamental movements in a variety of sports (Almosnino et al., 2013; Schoenfeld, 2010). Additionally, the coordination of major joints and numerous muscle groups in squat performance allows such movement to be frequently used in rehabilitation for improvement in quality of life and evaluation of movement competency (Schoenfeld, 2010; Swinton et al., 2012). However, due to its requirements of mobility and stability of multiple joints, poor technique can lead to an increased risk of injury (Krause et al., 2015; Schoenfeld, 2010). Analyzing its kinematics can help participants understand the correct form and improve their performance. Researchers analyzed the squatting motion to gain insights into different aspects of the movement and its performance (Almosnino et al., 2013; Crowe et al., 2019; Demers et al., 2018; Esformes & Bampouras, 2013; Kim et al., 2015; Lorenzetti et al., 2018; McKean & Burkett, 2012; Moore et al., 2016; Sato & Heise, 2012; Severin et al., 2017; Sorensen et al., 2001). Also, because of its exercise efficiency, squats are often added to core exercise routines to improve lower extremity muscular endurance, strength, and overall conditioning (Escamilla et al., 2000; Escamilla et al., 2001; Schoenfeld, 2010). Therefore, it is essential for kinesiology students, whose future careers often include athletic training and rehabilitation, to learn how to analyze the kinematics of squat.
To analyze the kinematics of squat, a motion analysis technique, among others (e.g., electrogoniometer, accelerometers and gyroscopes), is a suitable method for comprehensive movement analysis. A three-dimensional (3D) motion analysis system allows assessment of multiplane measurements, with accurate tracking motion and complete description in the three body planes in a wide range of motion analysis (e.g., combined rotation, flexion, adduction movements). Two-dimensional (2D) video analysis provides a simpler technique to analyze a particular plane of motion (e.g., knee flexion and extension) under specific settings. Generally, the more elaborate the system, the higher the cost, but the better the quality of objective data that can be provided. Nevertheless, despite some limitations the simpler techniques are valuable, particularly in non-clinical settings (e.g., gym, home, workplace) where the use of high technology systems is difficult due to space, cost, and time. Additionally, the 2D method allows quantitative analysis, which can further improve the quality of visual observations.
The validity of 2D analysis is specific to the plane of motion under examination, and the particular movement performed (Alahmari et al., 2020), and few studies have investigated the differences between 2D and 3D analysis of the squat (Escamilla et al., 2001; Krause et al., 2015; Schmitz et al., 2015). While 3D movement analysis is considered the gold standard for motion capture (Chung & Ng, 2012), it is often not available for all students, especially during the pandemic. Digital video analysis has been used in physics courses since the late 1990s and was found to be an effective addition to learning kinematics and interpreting graphs (Beichner, 1996; Escalada & Zollman, 1997; Laws & Pfister, 1998). As an alternative, 2D digital video analysis using free, open-source software (Bagesteiro, 2020) can be chosen in educational environments to provide hands-on experience. The current study aims to compare 2D and 3D motion capture measurements of narrow-stance squats for the purpose of applying the 2D technique for educational applications. This may promote students’ ability to engage in practical work and identify questions and concepts that guide investigations and construct critical argument and reasoning in professional and personal settings.
Fifteen healthy adults (nine females, six males; age 26.93 ± 9.04 years; height 1.70 ± 0.13 m; body mass 74.23 ± 18.36 kg; BMI (Body Mass Index) 25.22. ± 3.96 kg/m2) were recruited through word-of-mouth. The study was approved by the San Francisco State University ethics committee and the informed consent form was signed by each participant before the experiment. Participants’ previous experience and current frequency of exercise with squats were recorded. Thirteen participants reported to be familiar with the squatting motion, only two participants had never performed a squat prior to the experiment. Additionally, seven of the 15 participants performed squatting exercises at the frequency of twice per week or more. Three participants performed squats every other week. Six participants did not engage in regular squatting exercises. Furthermore, four participants mentioned the pandemic had diminished their exercise frequency. All participants were screened to have no compensation during overhead squats (see Fig. 1) and instructed to wear skin-tight shorts or tights during data collection. The overhead assessment was performed to observe participants’ overall posture and identify any related injuries or conditions (compensatory movements and muscle imbalances) that would prohibit them from safely performing a squat. Participants were instructed to perform a slow-paced squat for movement consistency across trials.
Figure 1
Overhead squat compensations (The Fitness Trainer Academy, 2015)
Participants visited the laboratory once and data collection was performed with one participant and two researchers present in a 93m2 area laboratory following proper COVID safety guidelines. Participants were instructed to perform squats in 3-1-3 rhythm (i.e., 3s down, 1s hold, 3s up) following a metronome set to 60 beats-per-minute (BPM). Three familiarization trials were performed, followed by the experimental trials. A narrow-stance squat was used to keep the lower limb parallel to the phone camera and avoid errors caused by image distortion. In addition, previous research showed (Escamilla et al., 2001; Hu et al., 2021) that 2D kinematic analysis is most accurate when measuring narrow-stance squat.
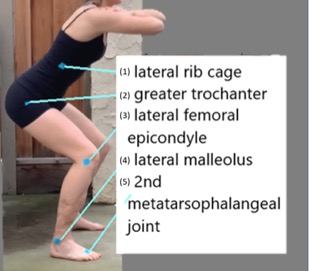
Five markers were attached to each side (left and right) of the participant (see Fig. 2). They included (1) lateral rib cage (midline of body), (2) greater trochanter, (3) lateral malleolus, (4) lateral femoral epicondyle, and (5) 2nd metatarsophalangeal joint. The experimental session was performed while six sagittal-view videos (three for each side, left and right) were recorded at 30 frames per second (fps) using smartphones. A rigid object of known dimensions was used to calibrate the video images. The recorded videos were processed using Tracker (a free video analysis and modeling tool – Open-Source Physics (OSP) Java framework – version 5.1.5. Brown, 2020), which was installed on researchers’ personal computers. Hip, knee, and ankle angles from the sagittal plane were obtained based on Tracker analyses.
Figure 2
Marker set for 2D analysis
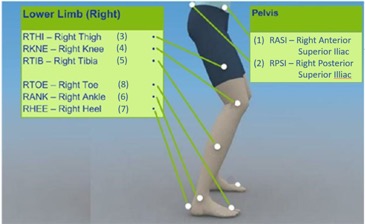
A 12-camera motion capture system (Vicon Motion Systems Ltd, Oxford, UK) was used to perform 3D analyses. The Vicon motion analysis system was calibrated prior to each experimental session. Anthropometric measurements were taken and inputted to Vicon Nexus software (version 2.10.0) to scale the plug-in-gait model calculations and data processing. Participant’s height and body mass were self-reported. Anterior superior iliac spine (ASIS) distance, knee width, and ankle width were measured using a caliper, and leg length was measured using a ruler. Sixteen reflective markers were attached to the participant’s lower extremity, including left and right (1) ASIS, (2) PSIS (posterior superior iliac spine), (3) thigh, (4) lateral femoral epicondyle, (5) shank, (6) lateral malleolus, (7) calcaneus, and (8) 2nd metatarsophalangeal joint (see Fig.3).
Figure 3
Marker set for 3D analysis – Vicon plug-in-gait model, right side view (Vicon Motion Systems Limited, 2008)
Movement trajectories were processed using MATLAB (R2020b) to obtain maximum changes in joint angles (hip, knee and ankle) and knee linear displacements (vertical and horizontal (antero-posterior (AP)). These joint kinematic measures are useful to describe body motions in different settings (e.g., therapists, athletic trainers, movement scientists). For each participant, joint angle data were calculated over time and normalized to total movement time for comparison. Movement start and end were set at 4% of peak hip linear displacement for both 2D and 3D analyses. The hip joint was selected because the squat is a close-chain movement, and it is the first to move. All trials were manually checked to confirm onset and termination of movement.
Statistical analyses on the average values of the three trials on each side were performed using R (3.6.1). Normality was assessed using Shapiro-Wilk tests, and the returned p values were all greater than 0.05 except for vertical knee displacements. Paired t-tests were used to assess the significance of paired differences for the data that satisfied the normality assumption, Cohen's d effect size was calculated, and Wilcoxon Rank Sum Test was used to assess the significance of 2D versus 3D differences in knee linear displacements.
Figures 4-6 illustrate normalized (% of movement time) 2D and 3D joint angles profiles (ensemble curves (± one standard deviation (SD)) for the squat motion. The patterns of motion are similar for both Tracker and Vicon analyses. All joint angles measured by each system started between zero- and 25-degrees flexion, increased to maximum flexion at around 50% of total movement time, and decreased to near zero (start position). Furthermore, this pattern fits the 3-1-3 squatting rhythm, where participants spent most of the time in the descending (0-45%) and ascending phases (65%-100%) of the squat.
Figure 4.
Hip flexion: comparison of 2D (Tracker, left) and 3D (Vicon, right) measures. Right (blue lines) and left (red lines) side measurements.

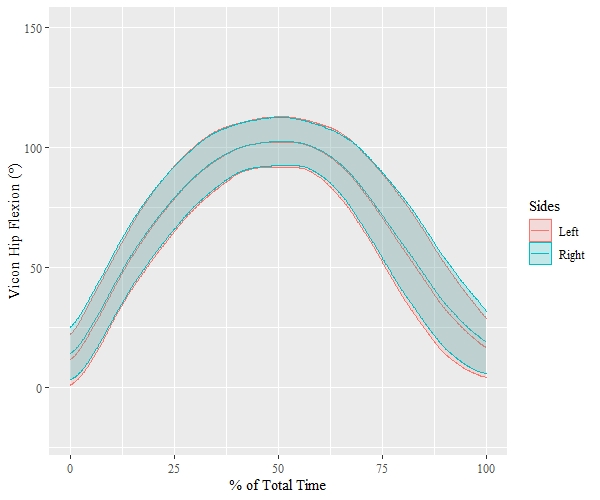
Note. Shadings represent ± SD.
Figure 5
Knee flexion: comparison of 2D (Tracker, left) and 3D (Vicon, right) measures. Right (blue lines) and left (red lines) side measurements

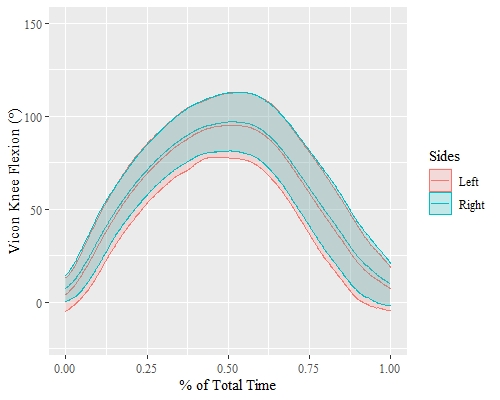
Note. Shadings represent ± SD.
Figure 6
Ankle dorsiflexion: comparison of 2D (Tracker, left) and 3D (Vicon, right) measures. Right (blue lines) and left (red lines) side measurements.

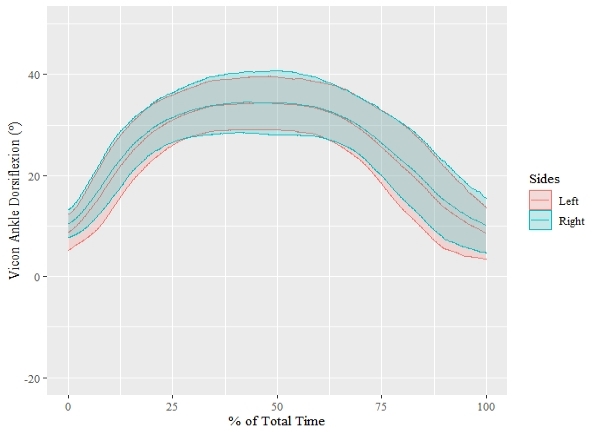
Note. Shadings represent ± SD.
Statistical significances were found when comparing 2D and 3D measurements. Angular changes at all three joints measured by Tracker (2D analysis) were found to be significantly different from those measured using with Vicon system (3D analysis). Joint angles measured by 2D and 3D systems were found to be significantly different at all three joints. Hip flexion in 2D measurements (107.92 ± 12.53) was significantly greater than 3D measurements (91.45 ± 10.52) with the largest effect size (t(29) = 6.64, p < 0.001, Cohen’s d = 1.47). In contrast to the higher 2D measurements in hip flexion, 2D analyses of knee and ankle angles were smaller than 3D analyses. Two-dimensional knee flexion measures (80.35 ± 12.59) were significantly smaller than 3D-measured knee flexion with a large effect size (92.63 ± 16.16, t(29) = -7.68, p < 0.001, Cohen’s d = 0.85). Additionally, ankle dorsiflexion was also found to be smaller in 2D measurements (21.80 ± 5.52) than in 3D measurements with a large effect size (26.12 ± 6.72, t(29) = -7.06, p < 0.001, Cohen’s d = 0.72). Knee linear measurements (antero-posterior (AP) and vertical) showed statistically significant differences when comparing 2D and 3D data, where 2D analysis consistently resulted in greater knee displacement measurements despite the direction. Tracker (2D analysis) measured greater horizontal (AP) displacements (0.22 ± 0.06) than Vicon (3D analysis) (0.15 ± 0.04), p < 0.001 (t(29) = 11.89, Cohen’s d = 1.42). Vertical displacements were also greater in 2D measurements (0.12 ± 0.05) than in 3D measurements (0.07 ± 0.02), p < 0.001 (Cohen’s d = 1.82). Mean 2D and 3D differences for all measurements are presented in Table 1.
Table 1
Mean differences between 2D and 3D angular and linear measurements (Mean ± SD).
|
|
Angular Displacement |
Knee Linear Displacement |
|||
|
|
Hip Flexion (o) |
Knee Flexion (o) |
Ankle Dorsiflexion (o) |
Antero-Posterior (m) |
Vertical (m) |
|
Mean Differences |
16.47 ± 2.01* |
-12.28 ± 3.57* |
-4.32 ± 1.20* |
0.07 ± 0.02* |
0.05 ± 0.03* |
Note. *p < 0.001.
Bilateral symmetry (Figures 7 and 8) was assessed using paired t-tests since all the measurements on the left and right lower limbs were normally distributed. Significance in bilateral differences were found in hip measurements. Statistical significance with a small effect size (Cohen’s d = 0.26) existed for 3D hip flexion when comparing the left (92.77 ± 10.29) and right sides (90.13 ± 10.69, p < 0.001). However, the differences in left and right hip angles measured by the 2D system had a negligible effect size (Cohen’s d = 0.02). No significant differences were found in other joint angles or knee displacements between limbs.
Figure 7
Comparison between 2D (Tracker) and 3D (Vicon) peak joint angles and right and left sides
![]()
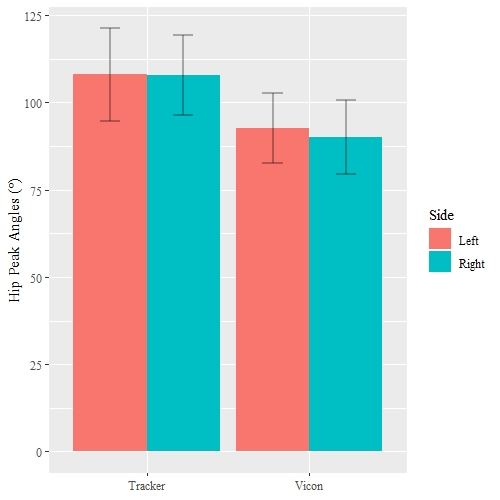

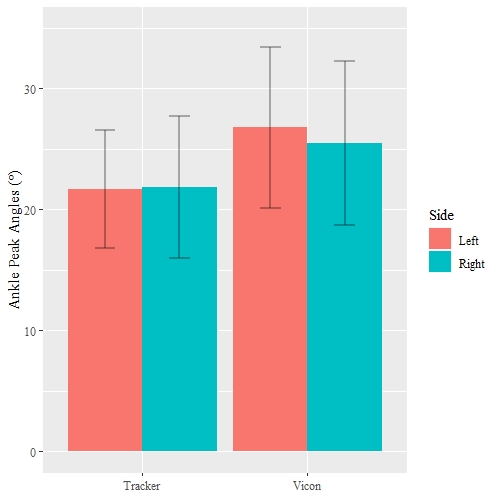
Notes. Left chart: Maximum hip flexion; Middle chart: Maximum knee flexion; Right chart: Maximum ankle dorsiflexion.
Figure 8
Comparison between 2D (Tracker) and 3D (Vicon) knee displacements and right and left sides
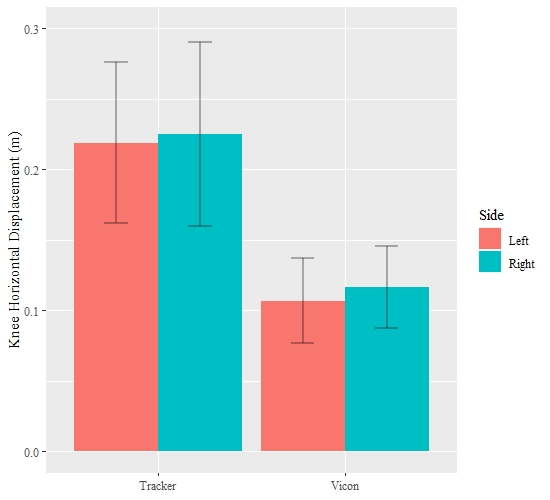
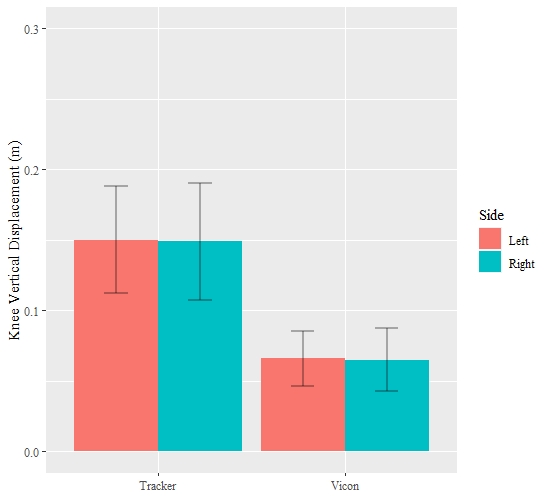
Notes. Left chart: Horizontal (AP); Right chart: vertical.
The resulting angular and linear measurements from both 2D and 3D analyses aligned with previous research. In the current study, hip flexion had an average of 106.57o (±13.38o) in 2D analysis and 91.40⁰ (± 11.60o) in 3D analysis. Both values for hip flexion fell into the range of 86.67o (± 8.30o) to 117.02o (± 9.88o) established by previous studies (Demers et al., 2018; Escamilla et al., 2001; Han et al., 2014; Mauntel et al., 2015; McKean & Burkett, 2012). Knee flexion in the current study also agreed with previous results. Past studies found that knee flexion in a narrow squat was generally between 92.67o (± 12.67o) to 147.10o (± 9.20o) (Demers et al., 2018; Escamilla et al., 2001; McKean & Burkett, 2012). While located at the lower limit of the range, both results in 2D analysis (83.24 ± 11.67o) and 3D analysis (95.29 ± 16.21o) were included in the established range. Similar to hip and knee flexion, measured ankle dorsiflexion was in alignment with earlier research. McKean and Burkett (2012), Han et al. (2014), and Demers et al. (2018) measured ankle dorsiflexion in a narrow squat to be 29.00o (± 6.00o) to 32.50o (± 5.00o), which overlapped with both the 2D angles (21.80 ± 5.52o) as well as the 3D angles (26.12 ± 6.72o). Additionally, knee 2D horizontal (anteroposterior) displacements (0.23 ± 0.06 m) supported data reported by Swinton et al. (2012) (0.22 ± 0.04 m) whereas 3D knee anteroposterior displacements (0.15 ± 0.04 m) were slightly smaller. The lesser knee flexion and ankle dorsiflexion were likely caused by reduction in physical activities during the COVID-19 pandemic since five out 12 participants reported a drop in exercise. The lack of exercise could cause a decline in lower extremity muscle strength, which was found to reduce squat depth (Kim et al., 2015).
Squat exercises are frequently regarded as a nearly symmetric task, with little difference in the movement between the two lower limbs. However, several sports require asymmetric movements, which can lead to bilateral asymmetry as a result of differences in sports-specific training and muscle strength. Bilateral differences in the hip-joint were observed; such results can be considered when attempting to decrease the risk of injury. The overall bilateral symmetry also agreed with previous studies (Moore et al., 2016; Severin et al., 2017) showing asymmetry in hip flexion reported in single-leg squats (Severin et al., 2017). The difference in hip flexion is possibly a result of lower limb dominance. Since lower limb dominance was not recorded in this study, future investigations are required to confirm such speculation. Measurements in the current study aligned with previous findings, suggesting the results to be reliable and appropriate for educational settings.
While the joint angle ranges in this study were consistent with those in past research, conflicting evidence was found on the distinctions between 2D and 3D analyses. While Escamilla and colleagues (2001) found no difference between 2D and 3D analyses of narrow squats, significant differences at all three joints were found by Krause et al. (2015), which supports our data. However, Krause et al (2015). found that the 2D software measured greater joint angles across all three joints, and the current study found that 2D joint angles were only greater at the hip and smaller at the knee and ankle joints (Fig. 6). The overestimation of hip flexion in 2D measurement is likely due to the simplification of pelvis motion (Krause et al., 2015). On the other hand, the underestimation of ankle dorsiflexion is possibly a product of camera placement. Although the camera was focusing on the lower extremities without obvious distortion, it filmed the ankle from a slightly higher angle causing the ankle to start with a false plantarflexion.
This study is not without limitations. Since this pilot study was conducted during the COVID-19 pandemic, 3D and 2D measurements were collected on two separate days as one of the necessary accommodations made to guarantee safety. Even though the squats were performed by the same subject, the subject might not have been able to repeat the same squats. Therefore, individual differences might contribute to inconsistent performances. Concurrent 2D and 3D measurements will need to be conducted to confirm the current findings. Additionally, while undergraduate students have verbally expressed their appreciation of hands-on experience over the course of this study, no testimonials were obtained. Individual or focus group interviews with a third-party can be beneficial to understand the students’ experiences throughout the remote laboratory activity without any potential pressure from the instructor.
Kinematic analysis of the bodyweight squat is essential among various fields within kinesiology, including athletic training and rehabilitation, making squat analysis important in kinesiology curriculum. While 3D measurements are considered the gold standard and provide the most accurate results, the 2D video analysis method applied in the current study offers location flexibility (i.e., no laboratory space required) and ease of use (i.e., basic hardware and open-source software) in different learning modalities. The current study found significant differences between 2D and 3D measurements at hip, knee, and ankle joints, yet all angular measurements fell within ranges established by previous research. This investigation supports the use of such 2D video analysis as an effective tool for measuring joint kinematics and its implementation in educational contexts. To further confirm the current findings and resolve limitations in this research, a mixed-method study with concurrent 2D and 3D recordings and focus group interviews needs to be conducted.
Special thanks to Gillian Grant, Jessica Batres and Katherine Vaccarezza for recruiting and screening participants.
Alahmari, A., Herrington, L., & Jones, R. (2020). Concurrent validity of two-dimensional video analysis of lower-extremity frontal plane of movement during multidirectional single-leg landing. Physical Therapy in Sport, 42, 40-45. https://doi.org/10.1016/j.ptsp.2019.12.009
Almosnino, S., Kingston, D., & Graham, R.B. (2013). Three-dimensional knee joint moments during performance of the bodyweight squat: effects of stance width and foot rotation. Journal of Applied Biomechanics, 29(1),33-43. https://doi.org/10.1123/jab.29.1.33.
Bagesteiro, L.B. (2020). Practical experiential learning: A methodological approach for teaching undergraduate biomechanics. Journal of Kinesiology and Wellness, 9(1), 58-68.
Beichner, R. (1996). The impact of video motion analysis on kinematics graph interpretation skills. American Journal of Physics, 64(10), 1272-1277 https://doi.org/10.1119/1.18390
Brinson, J.R. (2015). Learning outcome achievement in non-traditional (virtual and remote) versus traditional (hands-on) laboratories: A review of the empirical research. Computers & Education, 87, 218-237. https://doi.org/10.1016/j.compedu.2015.07.003.
Catena, R.D. & Carbonneau, K.J. (2018). Guided hands-on activities can improve student learning in a lecture-based qualitative biomechanics course. Anatomical Science Education, 12(5), 485–493.
Chung, P.Y. & Ng, G.Y. (2012). Comparison between an accelerometer and a three-dimensional motion analysis system for the detection of movement. Physiotherapy, 98(3), 256-9.
Cooper, M. (2005). Remote laboratories in teaching and learning – issues impinging on widespread adoption in science and engineering education. International Journal of Online and Biomedical Engineering, 1(1), 1-7.
Crouch, C.H., A.P. Fagen, J.P. Callan, & Mazur, E. (2004). Classroom demonstrations: Learning tools or entertainment? American Journal of Physics, 72(6),835–38.
Crowe, M.A., Bampouras, T.M., Walker-Small, K., & Howe, L.P. (2019). Restricted unilateral ankle dorsiflexion movement increases interlimb vertical force asymmetries in bilateral bodyweight squatting. Journal of Strength and Conditioning Research, 34(2), 332-336..
Demers, E., Pendenza, J., Radevich, V., & Preuss, R. (2018) The effect of stance width and anthropometrics on joint range of motion in the lower extremities during a back squat. International Journal of Exercise Science, 11(1), 764-775.
Escalada, L.T. & Zollman, D.A. (1997). An investigation on the effects of using interactive digital video in a physics classroom on student learning and attitudes. Journal of Research in Science Teaching, 34(5), 467-489.
Escamilla, R.F., Fleisig, G.S., Zheng, N., Lander, J.E., Barrentine, S.W.,Andrews, J.R., Bergemann, B. W., & Mooran, C.T. (2000). Effects of technique variations on knee biomechanics during the squat and leg press. Medicine & Science in Sports & Exercise, 33(9), 1552-1566.
Escamilla, R. F., Fleisig, G. S., Lowry, T. M., Barrentine, S. W., & Andrews, J., R. (2001). A three-dimensional biomechanical analysis of the squat during varying stance widths. Medicine and Science in Sports and Exercise, 33(6), 984-998. https://doi.org/10.1097/00005768-200106000-00019.
Esformes, J.I. & Bampouras, T.M. (2013). Effect of back squat depth on lower-body postactivation potentiation. Journal of Strength and Conditioning Research, 27(11), 2997–3000.
Han, S., Ge, S., & Liu, H. (2014). Gender differences in lower extremity kinematics during high range of motion activities. Journal of Medical Imaging and Health Informatics, 4, 272–276. https://doi.org/10.1166/jmihi.2014.1236
Hu, G., Wang, W., Chen, B., Zhi, H., Li, Y., Shen, Y., & Wang, K. (2021). Concurrent validity of evaluating knee kinematics using Kinect system during rehabilitation exercise. Medicine in Novel Technology and Devices, 11(9),100068.https://doi.org/10.1016/j.medntd.2021.100068.
Julian, G.M. (1995). A demonstration on every exam. The Physics Teacher, 33 (4),248–250.
Kim, S.H., Kwon, O.Y., Park, K.N., Jeon, I.C., & Weon, J.H. (2015). Lower extremity strength and the range of motion in relation to squat depth. Journal of human kinetics, 45, 59–69. https://doi.org/10.1515/hukin-2015-0007.
Krause, D.A., Boyd, M.S., Hager, A.N., Smoyer, E.C.,Thompson, A.T., & Hollman, J.H. (2015). Reliability and accuracy of a goniometer mobile device application for video measurement of the functional movement screen deep squat test. The International Journal of Sports Physical Therapy, 10(1), 37-44.
Laws, P.W., & Pfister, H. (1998). Using digital video analysis in introductory mechanics projects. The Physics Teacher, 36(5), 282–287.
Lorenzetti, S., Ostermann, M., Zeidler, F., Zimmer, P., Jentsch, L., List, R., Taylor, W. R., & Schellenberg, F. (2018). How to squat? Effects of various stance widths, foot placement angles and level of experience on knee, hip and trunk motion and loading. BMC Sports Science, Medicine & Rehabilitation, 10, 14. https://doi.org/10.1186/s13102-018-0103-7
Ma, J. & Nickerson, J.V. (2006). Hands-on, simulated, and remoted laboratories: A comparative literature review. ACM Computing Surveys, 38(3), 7-es.
Mauntel, T.C., Post, E.G., Padua, D.A., & Bell, D.R. (2015). Sex differences during an overhead squat assessment. Journal of Applied Biomechanics, 31(4), 244 -249. http://dx.doi.org/10.1123/jab.2014-0272
McKean, M., & Burkett, B. J. (2012). Does segment length influence the hip, knee and ankle coordination during the squat movement? Journal of Fitness Research, 1(1), 23–30.
Milner-Bolotin, M., Kotlicki, A., & Rieger, G. (2007). Can students learn from lecture demonstrations? The role and place of interactive lecture experiments in large introductory science courses. Journal of College Science Teaching, 36(4) 45-49.
Moore, J.M., Mulloy, F.E., Bridle, C., & Mullineaux, D.R. (2016). Leg dominance effects on knee kinematics in unilateral and bilateral squats. ISBS Proceedings Archive - 34th International Conference of Biomechanics in Sport, 315-318.
Roth, W.M., C.J. McRobbie, K.B. Lucas, & Boutonne, S. (1997). Why may students fail to learn from demonstrations? A social practice perspective on learning in physics. Journal of Research in Science Teaching, 34(5), 509–33.
Sato, K. & Heise, G.D. (2012). influence of weight distribution asymmetry on the biomechanics of a barbell back squat. Journal of Strength and Conditioning Research, 26(2), 342–349.
Schmitz, A., Ye, M., Boggess, G., Shapiro, R., Yang, R., & Noehren, B. (2015). The measurement of in vivo joint angles during a squat using a single camera markerless motion capture system as compared to a marker based system. Gait & Posture, 41(2), 694-698. http://dx.doi.org/10.1016/j.gaitpost.2015.01.028
Schoenfeld, B.J. (2010). Squatting kinematics and kinetics and their application to exercise performance. Journal of Strength and Conditioning Research, 24(12), 3497-3506.
Severin, A.C. Burkett, B., McKean, M.R., Wiegand, A.N., & Sayers, M.G.L. (2017). Limb symmetry during double-leg squats and single-leg squats on land and in water in adults with long-standing unilateral anterior knee pain; a cross sectional study. BMC Sports Science, Medicine and Rehabilitation, 9, 20, https://doi.org/10.1186/s13102-017-0085-x
Sokoloff, D.R., & Thornton, R.K. (2004). Interactive lecture demonstrations: Active learning in introductory physics. John Wiley and Sons.
Sorensen, Christopher J, Haddad, Omid, Campbell, Samuel, & Mirka, Gary A. (2011). The effect of stance width on trunk kinematics and trunk kinetics during sagitally symmetric lifting. International Journal of Industrial Ergonomics, 41(2), 147–152. https://doi.org/10.1016/j.ergon.2010.12.007
Swinton, P., Lloyd, R., Keogh, Keogh, J.W.L., Agouris, I., & Stewart, A.D. (2012). A Biomechanical Comparison of the Traditional Squat, Powerlifting Squat, and Box Squat, Journal of Strength and Conditioning Research, 26(7), 1805-1816. https://doi.org/10.1519/JSC.0b013e3182577067
The Fitness Trainer Academy. (2015, October 5). The overhead squat assessment. The Fitness Trainer Academy https://www.thefitnesstraineracademy.org/blog/the-overhead-squat-assessment/.
Vicon Motion Systems Limited. (2008). Vicon Plug-in Gait Product Guide—Foundation Notes Revision 1.0. Denver, CO: OMG plc.
*Address correspondence to:
Leia B Bagesteiro. Ph.D.
Department of Kinesiology
San Francisco State University
San Francisco, CA 94132
Email: lbb@sfsu.edu
![]()
Journal of Kinesiology and Wellness © 2022 by Western Society for
Kinesiology and Wellness is licensed under CC BY-NC-ND 4.0