Western Society for Kinesiology and Wellness
John Massengale Papers
RECOGNIZING A SPONSOR’S NAME IS DIFFERENT FROM BEING ATTRACTED TO A SPONSOR
Authors: Park, S. R., Ph.D., Gonzaga University, Gavigan, J., and Brabazon, M., Hillsboro Hops
Abstract
As mainstream as sport sponsorship has become, it may be unreasonably optimistic to expect that simply placing product logos, banners, and signs at a sporting facility will automatically attract the sport spectator’s attention (Choi, Stotlar, & Park, 2005; Park & Choi, 2011). A number of factors beyond simple logo exposure may determine the likelihood of a stimulus being attended to and remembered. The main purpose of this study was to identify whether the sponsored promotional activities at a sporting venue, such as logo placement, product demonstrations, hospitality centers, etc., actually can attract the eye and attention of fans. A total of 27 graduate and undergraduate students (18 years or above) who were enrolled in a sport management program at a college in the Northwestern United States were asked to participate in this study. The participants attended the Spokane Shock games on March 12th, March 30th, and April 14th of 2012. A total of 13 people (138 photos) successfully provided the photos and short essays in a timely manner. Photos were analyzed and separated into four categories (see table 1): (1) visual signage (VS) – standard non-digital signage including field signage, (2) PA announcement (PA) – digital signage and products brought onto field as announced by the public address announcer, (3) personal contact (PC) – fans, mascots, employees and promo employees, and (4) giveaways (GW) – items handed to fans or picked up from display tables, including merchandise and concessions. As seen in table 2, the most frequently recalled five sponsors were Dishman Dodge (24.3%), George Gee Kia (10.7%), Century Link (8.3%), Tailgator (4.1%), and Rockwood (4.1%).
PROJECT
As mainstream as sport sponsorship has become, it may be unreasonably optimistic to expect that simply placing product logos, banners, and signs at a sporting facility will automatically attract the sport spectator’s attention (Choi, Stotlar, & Park, 2005; Park & Choi, 2011). A number of factors beyond simple logo exposure may determine the likelihood of a stimulus being attended to and remembered. For any given sign or logo, a number of factors work simultaneously to encourage and discourage the spectators’ attention and memory. In order to meet the sponsorship marketing goals and objectives, sponsors are required to develop well-designed and appropriate on-site activation plans depending on the nature of the sporting events and venue types and locations (DeGaris, West, & Dodds, 2009). Much has been made of sponsorship activation in the trade literature and in practice, yet to date no empirical efforts has been made to determine the importance of sponsorship practices and on-site promotional activities that are used to place the brand in the consumer’s active mental processing at the event.
Few researchers have tried to measure the effectiveness of on-site promotions in a qualitative way even though several limitations associated with the quantitative approach have been reported in previous literature (Choi, Stotlar, & Park, 2005; Park & Choi, 2011). Thus, the main purpose of this study is to identify whether the sponsored promotional activities at a sporting venue, such as logo placement, product demonstrations, hospitality centers, etc., actually attract the eye and attention of fans.
MEANS
A total of 27 graduate and undergraduate students (18 years or above) who were enrolled in a sport management program at a college in the Northwestern United States were asked to participate in this study. The participants attended the Spokane Shock games on March 12th, March 30th, and April 14th of 2012. The participants were educated about the purpose of this study, ethnographical view, and the photo-journaling technique prior to attending the scheduled Spokane Shock’s games. Research participants were asked to bring individual digital cameras (or camera phones) to perform their assigned tasks in the research. The participants were asked to take pictures throughout a three-hour duration with the digital cameras (or camera phones) and the pictures were to represent the subject or scenes that catch the participant’s attention. The participants were asked to walk around the venue during games to better see the signs and logos from the diverse locations by interacting with sponsors, fans, and media, etc., except club seats and luxury suites, to which they had no access. Since the focus of this study was on evaluating visual effectiveness of sponsors’ promotional activities, the participants were provided a short-essay assignment to review and explain their reasoning for their photo choices. The completion of the structured assignment was an essential component of data collection in this study, because the participants were given an opportunity to review and explain the reason for taking the photo they had taken.
In the process of analyzing the photos and data, an in-depth understanding method rather than mere description, an analytical technique recommended by LeCompte & Preissle (1993), was used in order to fully benefit from a qualitative methodology by increasing the validity of this current study. Data were organized around certain topics, key themes, or central questions for interpretations (Cassell & Symon, 2004). As Neuendorf (2002) suggested, inter-rater reliability was established since the researchers participated as human coders in content analysis. The coders corresponded their judgments to those from the typical person and calculated and reported percent of agreement for inter-rater reliability. Photos were placed into the best category based on view of picture taken. For example, in the event a picture could both be classified within the “personal contact” category and the “giveaway” category, the picture was categorized based on the focus of the picture.
OUTCOME AND REFLECTION
A total number of 13 people (138 photos) successfully provided the photos and short essays in a timely manner. Photos (see Figure 1) were analyzed and separated into four categories (see Table 1): (1) visual signage (VS) – standard non-digital signage including field signage, (2) PA announcement (PA) – digital signage and products brought onto field as announced by public address announce, (3) personal contact (PC) – fans, mascots, employees and promo employees, and (4) giveaways (GW) – items handed to fans or picked up from display tables, including merchandise and concessions. A total of 148 fans out of 191 who participated in the survey successfully recalled Spokane Shock’s sponsors. As seen in the Table 2, the most frequently recalled five sponsors were Dishman Dodge (24.3%), George Gee Kia (10.7%), Century Link (8.3%), Tailgator (4.1%), and Rockwood (4.1%).
|
|
|
|
|
|
|
|
|
|
|
|
|
|
|
|
|
|
|
Figure 1. Photo examples of unit codes. |
|
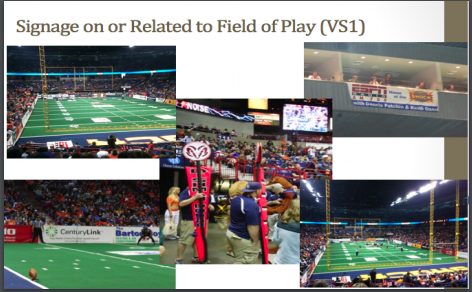
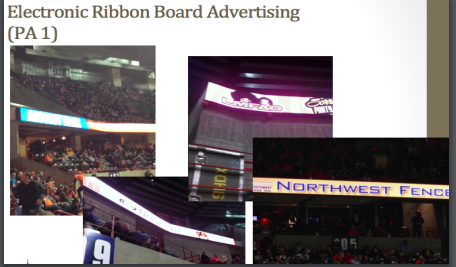
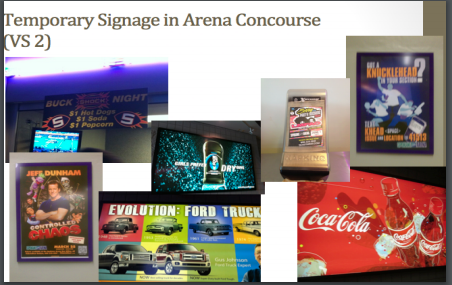
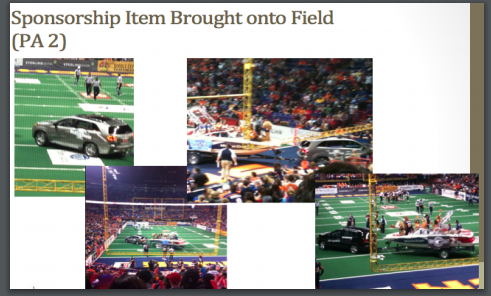
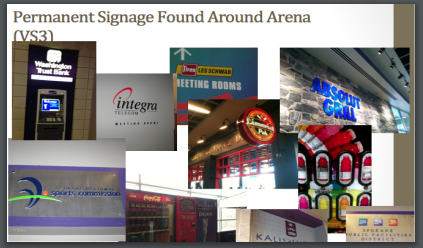
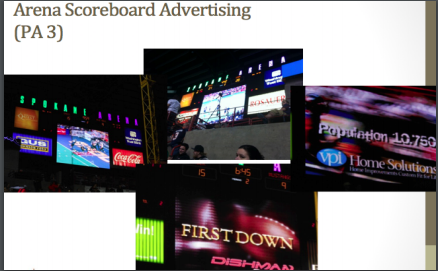
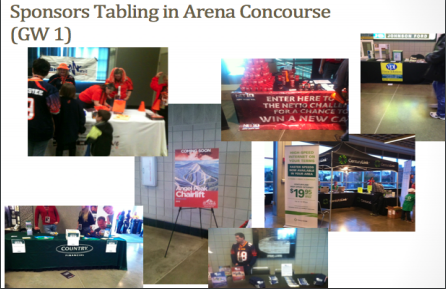
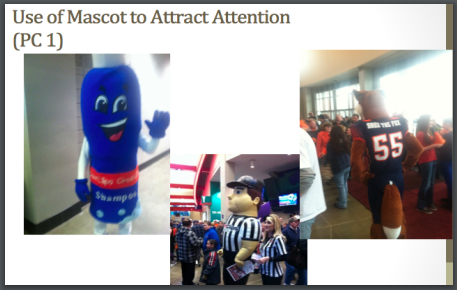
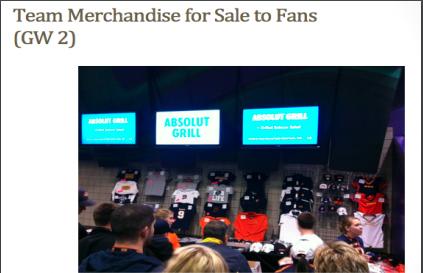
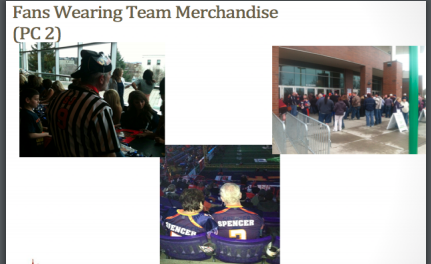
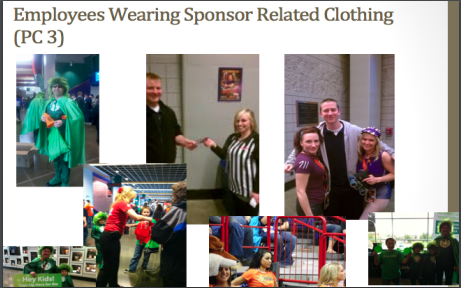
Table 1. Units and Numbers of Corresponding Photos
|
Condensed Analysis Unit |
Unit Code |
# of Photos n=138 |
|
1. Signage on or related to field of play |
VS 1 |
13 |
|
2. Temporary signage in arena concourse |
VS 2 |
29 |
|
3. Permanent signage found around arena |
VS 3 |
21 |
|
4. Electronic ribbon board advertising |
PA 1 |
4 |
|
5. Sponsorship item brought onto field |
PA 2 |
5 |
|
6. Arena scoreboard advertising |
PA 3 |
6 |
|
7. Use of mascot to attract attention |
PC 1 |
7 |
|
8. Fans wearing tea merchandise |
PC 2 |
3 |
|
9. Employees wearing sponsor related clothing |
PC 3 |
12 |
|
10. Sponsor tabling in arena concourse |
GW 1 |
16 |
|
11. Team merchandise for sale to fans |
GW 2 |
1 |
|
12. Promotional items handed out to fans |
GW 3 |
21 |
Table 2. Frequency of Unaided Recall Sponsorships
|
Sponsorships |
Responses |
Cases |
Sponsorships |
Responses |
Cases |
||
|
|
N |
% |
% |
|
N |
% |
% |
|
Rosauer |
2 |
1.2 |
1.4 |
Harbo Freight |
1 |
0.6 |
0.7 |
|
Swinging Doors |
5 |
3.0 |
3.4 |
Sterling Savings |
1 |
0.6 |
0.7 |
|
Dishman Dodge |
41 |
24.3 |
27.7 |
Century Link |
14 |
8.3 |
9.5 |
|
George Gee Kia |
19 |
19.7 |
12.2 |
Spalding |
1 |
0.6 |
0.7 |
|
Northwest Fence |
2 |
1.2 |
1.4 |
49 North |
1 |
0.6 |
0.7 |
|
Tailgater |
7 |
4.1 |
4.7 |
Group Health |
1 |
0.6 |
0.7 |
|
Dick’s Hamburger |
1 |
0.6 |
0.7 |
Deaconess |
5 |
3.0 |
3.4 |
|
ESPN |
2 |
1.2 |
1.4 |
Moxie |
2 |
1.2 |
1.4 |
|
Dave Smith |
1 |
0.6 |
0.7 |
Zips |
2 |
1.2 |
1.4 |
|
Zip Trip |
5 |
3.0 |
3.4 |
Reck Star |
2 |
1.2 |
1.4 |
|
Toyota |
5 |
3.0 |
3.4 |
Noodle Express |
2 |
1.2 |
1.4 |
|
Rockwood |
7 |
4.1 |
4.7 |
Northern Guest |
1 |
0.6 |
0.7 |
|
Outback Steakhouse |
1 |
0.6 |
0.7 |
KHO |
3 |
1.8 |
2.0 |
|
Dutch Bros |
1 |
0.6 |
0.7 |
Net 10 |
1 |
0.6 |
0.7 |
|
Hampton Inn |
1 |
0.6 |
0.7 |
39 |
1 |
0.6 |
0.7 |
|
Great Clips |
1 |
0.6 |
0.7 |
40 |
2 |
1.2 |
1.4 |
|
Barton Boys |
1 |
0.6 |
0.7 |
41 |
1 |
0.6 |
0.7 |
|
KFC |
4 |
2.4 |
2.7 |
42 |
1 |
0.6 |
0.7 |
|
Bog Trout Lodge |
3 |
1.8 |
2.0 |
43 |
1 |
0.6 |
0.7 |
|
Red Lion |
1 |
0.6 |
0.7 |
44 |
1 |
0.6 |
0.7 |
|
Avista |
2 |
1.2 |
1.4 |
45 |
2 |
1.2 |
1.4 |
|
UPI |
6 |
3.6 |
4.1 |
46 |
1 |
0.6 |
0.7 |
|
Zateca |
1 |
0.6 |
0.7 |
47 |
2 |
1.2 |
1.4 |
|
CdA Casion |
2 |
1.2 |
1.4 |
Total |
169 |
100 |
114.2 |
This study has two limitations. First, convenient sampling was used. Participants might be biased due to the fact that they were educated about and familiar with the rationale of sport sponsorships and onsite activations because of enrollment in a sport marketing class. Second, this study did not control for external factors such as the shape of the banners and signage at the venue, the team’s performance, and time of the game, etc.
REFERENCES
Cassell, C., & Symon, G. (2004). Essential guide to qualitative methods in organizational research. London: Sage.
Choi, J. A., Stotlar, D. K., & Park, S. R. (2005). Visual Ethnography of On-site Sport Sponsorship Activation: LG Action Sports Championship. Sport Marketing Quarterly, 15(2), 71-79.
DeGaris, L., West, C., & Dodds, M. (2009). Leveraging and activating NASCAR sponsorships with NASCAR-linked sales promotions. Journal of Sponsorship, 3(1), 88-97.
LeCompte, M. D., & Preissle, J. (1993). Ethnography and qualitative design in educational research (2nd edition). Waltham, MA: Academic Press.
Neuendorf, K. A. (2002). The content analysis guidebook. Thousand Oaks, CA: Sage Publications.
Park, S. R., & Choi, J. A. (2011). Visual/Logo-identity in the Major League Baseball. International Journal of Applied Sports Science, 23(1), 251-270.