Western Society for Kinesiology and Wellness
John Massengale Papers
VISUAL ETHNOGRAPHY OF ON-SITE SPONSORSHIP ACTIVATIONS: A CASE STUDY OF SPOKANE SHOCK
Authors: S. R. Park, Gonzaga University and P. Han, SUNY Cortland
Abstract
Sport
sponsorship has become an effective marketing communication tool in business
and a set of clearly defined marketing goals and objectives for engagement have
been established, including to increase awareness of the company and its
services, to enhance company image, to build business and trade relations and
goodwill, to enhance employee morale, and to boost sales products and services,
etc. (Irwin, Sutton, & McCarthy, 2002; Stotlar, 2005). In order to meet the
sponsorship marketing goals and objectives, sponsors are required to develop
well-designed and appropriate on-site activation plans depending on the nature
of the sporting events and venue types and locations (DeGaris, West, &
Dodds, 2009). Unfortunately, few researchers tried to measure the effectiveness
of on-site promotions in a qualitative way even though several limitations
about quantitative approach as an effective measurement tool have already been
reported in the previous literature (Choi, Stotlar, & Park, 2005).
The purpose of this current study is to identify whether the sponsored
promotional activities at a sporting venue, such as logo placement, product
demonstrations, hospitality centers, etc., actually matched with the interests
of spectators from a qualitative perspective. The primary data for this
research were generated by photo-journaling. Eleven graduate students were
recruited at a private northwestern university. Research participants were
asked to bring digital cameras to perform their duties in the research. Each
person was required to take at least 10 pictures of images that attracted
his/her attention at the venue. A total number of 110 pictures were collected
and they were categorized based on the same or similar marketing and
promotional theme by using inter-rater reliability (Neuendorf, 2002). The
researchers looked at each one trying to find common themes across the board,
while recalling some of the participants’ interesting comments associated with
each photo taken. Some dominant themes were identified and the photos were
grouped together accordingly, and some less-dominant themes or even outliers
were also spotted. The dominant themes included the following categories; (a)
visual signage such as standard non-digital A board signature, (b) PA
announcement such as digital signage and products brought onto field for
on-site promotional purpose, (c) personal contact such as mascots, sponsors’
employees and promotion workers, and (d) giveaways such as items handed to fans
or picked up from display tables. All other categories than listed above were
named as less-dominant themes due to the small number of cases that were not
enough to extract the theme.
INTRODUCTION
Sponsorship in sporting events and facilities has become popular as a marketing communication strategy. Numerous research papers (Choi, Stotlar, Park, 2005; Irwin, Sutton, & McCarthy, 2002; Ukman, 2004) have been published in the realm of sport sponsorship to answer questions including: 1) how much should be spent on the sport sponsorship?, 2) what influence does prior attitudes, knowledge and intention have on the received meaning of sponsorship communications?, and 3) what impact does sport sponsorship communication have on brand awareness, product interest and trial? Due to the nature of sport sponsorship evaluations, it is difficult to determine what exactly should be evaluated and measured. Even though there is no ideal evaluation available, several scholars have tried to measure sponsorship effectiveness (Bennett et al., 2002; Javalgi et al., 1994; Laninoit & Queser, 2001; Nocholls et al., 1999). Most of the aforementioned studies focused on the visibility of sponsorship logos and signs instead of measuring how consumers and fans perceive sponsorships. Thus, the main purpose of this current study was to identify and confirm whether sponsors’ on-site activations at a sporting venue, such as logo placement, product demonstrations, hospitality centers, etc., actually matched with the interests of spectators from a qualitative perspective. The primary data for this research was generated by a photo-journaling method as Park and Choi previously applied into the sporting events such as LG Action Sports World Championships in 2004 and Tampa Bay Rays in 2007 (Park & Choi, 2011).
METHOD
Sample and Procedures
A subject population of 12 (11 graduate students and 1 volunteer outside the class) (18 years or above) who were attending a sport & athletic administration program at a northwestern college of the United States were recruited on a voluntary basis. The participants attended the Spokane Shock game on April 1st of 2011. The participants were educated about the purpose of this study, ethnographical view, and photo-journaling technique prior to attending the scheduled Spokane Shock’s game because most participants were taking a Sport Promotions course as well as Research Method/Statistics course at the that time. In addition, information on sport sponsorship and on-site promotional activities had been provided through a sport marketing and promotions course. Research participants were asked to bring individual digital cameras or camera phones to perform their assigned tasks in the research. The participants were asked to take pictures throughout a three-hour duration with the digital cameras or camera phones and the pictures were to represent the subject or scenes that caught the participant’s attention. The participants were asked to walk around the venue during a game to better see the signs and logos from the diverse locations by interacting with sponsors, fans, and media, etc. An exception to this expectation was club seats and luxury suites because the students did not have access to these areas. Since the focus of this study was on evaluating visual effectiveness of sponsors’ promotional activities, the participants were also asked to complete a short-essay assignment to review and explain the reason for taking the photo they had taken.
RESULTS
Data Analysis
The primary data for this research was generated by the photo-journaling methodology that Choi, Stotlar, & Park (2005) and Park & Choi (2011) successfully utilized. The pictures that the participants took were explained through a given assignment and each participant was required to describe specific reasons for the individual picture that they had taken at the venue. In the process of analyzing the photos and data (an in-depth understanding rather than mere description) an analytical technique recommended by LeCompte & Preissle (1993) was focused on in order to fully benefit from a qualitative methodology which has been confirmed in the previous studies (Choi et al., 2005; Park & Choi, 2011). The pictures that the participants took were sent to the researchers within a week after the actual game day to discuss and analyze. A total of 96 photos were successfully stored in a PC and a categorical analysis was conducted by reviewing all the pictures to derive common categories or themes in light of participant’s comments about each photo taken. The data was organized around certain topics, key themes, or central questions for interpretations (Cassell & Symon, 2004).
Findings
Little research has been conducted evaluating the effectiveness of on-site sponsorship activation vis-à-vis matching spectator interests with sponsor programs. In addition, a study involving sponsorship evaluation for burgeoning sport like the Arena Football League is even more rare. Furthermore, past studies on sport sponsorship evaluation in qualitative methods are almost non-existent (Choi, Stotlar, & Park, 2005; Park & Choi, 2011). The feedback from the participants, however, strongly suggests that the photo-journaling experience clearly educated them about the product.
A total of 110 photos were collected and 96 of them were usable for this current study. With approximately 96 photos returned, we first stored them in a PC hard drive in a locked office and looked at each one trying to find common themes across the board, while recalling some of the participants’ interesting comments associated with each photo taken. In order to minimize the potential errors that might come from the recalling process, they were only given a week to accomplish the given assignment to report to the primary investigator. Some dominant themes were identified and the photos were grouped together accordingly, and some less-dominant themes or even outliers were also spotted.
According to the inter-rater reliability method, a total of 5 overlapped themes were extracted including “media board,” “employees/staffs,” “fans/spectators,” “performance field/playground,” and “interactive on-site promotions.”
Media Board. Nine of 12 participants took at least one photo of the media board’s logo (see Figure 1). From the structured assignment, it was discovered that media board has captured participants’ eyes and attention at the venue with the following reasons: “I really liked the colorful display that ran along the front of the upper deck,” “The bright lights on the video screen were amazing,” “Video board showing a unique look of imaging for the game,” and “Instant replay on the big screen allows for more than just recap of the previous plays.”
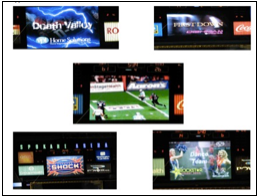
Figure 1. Examples of media boards.
Employees/Staffs. Another popular theme from the photo-journaling activity was the concept of event staff. Several people took photos of employees/event staffs, including security personnel, and other unknown staff members (see Figure 2). Remarks included, “Safety measures are always taken to make sure everyone is accommodated,” “Staff keeping a watchful eye on the fans entering the arena,” “Sometimes the staff can be a site to see other than the players and fans,” and “Staff making sure that everyone is behaving appropriate" [sic].
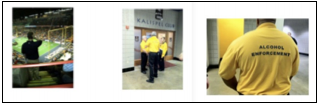
Figure 2. Examples of staff
Fans/Spectators. One of the most interesting observations from watching these participants’ photos came from other fans’ behaviors (see Figure 3). Other fans’ voluntary aggressiveness and loyalty in a positive way left the many fans with strong perceived fandom. For instance, some avid fans were dressed up with funky wigs and team’s colorful shirts and pants. The remarks included, “Fans behave wildly around the visiting opponent’s bench down below,” “Immediately walking into the arena being greeted by crazy fans,” “Fans react to others dancing in the crowd,” and “Team supporters passing out signs to enhance the home field advantage.”
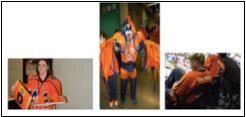
Figure 3. Examples of fans and spectators
Performance Field. The performance field was the location where the players were performing. Arguably, the performance field must have been the main spot to attract most peoples’ eyes and attention (see Figure 4). The main comments included, “The team huddles around the field logo of Toyota,” “The Toyota logo is the most visible logo on the field,” “During the pre-game production the Toyota logo is spotlighted,” and “It’s the kickoff and the players are running right on the Toyota logo.”
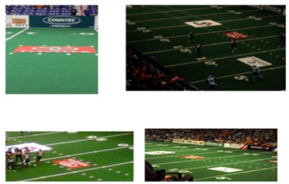
Figure 4. Examples of playing fields.
Interactive On-site Promotions. The theme of the last photo category was grouped as “interactive on-site promotions.” There were many sponsors’ logos and signs, but no one conducted their own onsite promotional activities better than “Bryan Cooling” and “Applebees” (see Figure 5). The mascots for Bryan Cooling and Applebees performed well enough to impress the fans at the venue. Many fans were satisfied with the mascots’ behaviors and wanted to have pictures taken together. The comments included, “The Bryan Cooling and Heat mascot was hard not to notice walking around in his superman outfit,” “Bryan Cooling is right there marketing throughout the entire game greeting fans,” “The Applebee’s mascot having fun with the fans,” and “Applebee’s really putting their best “B” forward in attracting attention to fans walking to their seats.”
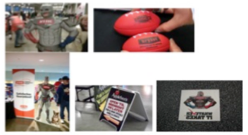
Figure 5. Examples of on-site promotion tactics.
DISCUSSION
Based on the photo-journaling method, this study found that the aforementioned themes extracted in this study provide completely different perspectives on what the spectators find “interesting” and “meaningful” at the Spokane Shock game. Secondly, this study has put things in perspective for many sport marketers in that logo placement, along with myriad of other sponsored activities at the venue, is just a small fraction of what the spectator visually records and assigns meaning to. Third, the recognition of sponsored on-site promotions definitely exists, but in order to provide truly meaningful experience that persists in the heart of consumers, there is room for improvement. Lastly, what this research valued most were some of the revelations that were unveiled in the photo-journaling activities.
This study also has a few limitations. There are factors outside of the scope of the current research that could influence the probability of any given advertiser having their sign attended to and remembered. These factors include, among other things, the shape of the advertising, the quality of the team’s performance, and the sheer number of advertisements presented. Therefore, future research should look into different types of sporting events, different shapes of advertisements, and different locations of franchises.
REFERENCES
Bennett, G., Henson, R., & Zhang, J. (2002). Action Sports Sponsorship Recognition. Sport Marketing Quarterly, 11(3), 174-185.
Choi, J. A., Stotlar, D. K., & Park, S. R. (2006). Visual ethnography of on-site sport sponsorship activation: LG action sports championship. Sport Marketing Quarterly, 15(2), 71-79.
Irwin, R. L., Sutton, W. A., & McCarthy, L. M. (2002). Sport promotion and sales management. Champaign, IL: Human Kinetics.
Javalgi, R. G., Traylor, M. B., Gross, A. C., Lampman, E. (1994). Awareness of sponsorship and corporate image: An empirical investigation. Journal of Advertising, 23(4), 47-58.
Laninoit, T., & Queser, P. G. (2001). Attitudinal effects of combined sponsorship and sponsor’s prominence on basketball in Europe. Journal of Advertising Research, 41(1), 48-58.
LeCompte, M. D., & Preissle, J. (1993). Ethnography and qualitative design in educational research. (2nd ed.). Orlando, FL: Academic Press.
Neuendorf, K. A. (2002). Content analysis guidebook. Thousand Oaks, CA: Sage Publications, Inc.
Nicholls, J. A. F., Roslow, S., & Dublish, S. (1999). Brand recall and brand preference at sponsored golf and tennis tournaments. European Journal of Marketing, 33(3), 365-386.
Ukman, L. (2004). Return on Sponsorship: How to measure, justify and maximize your return on sponsorships and partnerships. Chicago, IL: IEG, Inc.