INTRODUCTION
Bone mineral
density (BMD) and bone strength are important parameters of skeletal health.
Currently, dual-energy x-ray absorptiometry (DXA) is the gold standard to
measure BMD and it has been widely used in the clinical and research settings (Shuhart et al., 2019). The diagnosis of osteoporosis or low
bone mass highly relies on BMD measurement. According to the World Health
Organization (WHO, 2004), osteoporosis in postmenopausal women or older men is
defined as BMD being ≥ 2.5 SD below the mean for healthy young adults (Baim et
al., 2005). Furthermore, research has shown that a decrease of one standard
deviation (SD) in BMD is associated with a 1.5 - 2.6-fold increase risk of
fracture (Marshall, Johnell, & Wedel, 1996). Therefore, DXA measurements on
femoral neck BMD are used in conjunction with the WHO Fracture Risk Assessment
(FRAX) to estimate an individual’s 10-year risk of hip and major osteoporotic
fractures (Kanis et al., 2000: Kanis et al., 2011).
Although the
measurement of BMD is typically performed in older adults, it is a valuable
assessment for individuals at any age. Peak bone mass, which is the maximum
density and strength an individual’s bone can attain, is associated with the
risk of osteoporotic fracture (Heaney et al., 2000) and is established between
the ages of 20 and 30 (Hendrickx, Boudin, & Van Hul, 2015). Thus,
performing BMD measurements to assess skeletal health during young adulthood
can provide important information to young adults so they can invest time in
building up their skeletal health sooner rather than later. In addition, there
are sex and ethnicity differences in bone density and risk of fractures. Males
generally have a higher BMD than females at any given age due to their larger
body mass and lean mass (Makovey, Naganathan, & Sambrook, 2005; Zhu, Briffa,
Smith, Mountain, & Briggs, 2014). Research indicates that black women and
men have the lowest risk of fractures, Mexicans and Caucasians are the
intermediates, and Asians have the highest risk of fractures (Ishii et al.,
2011).
DXA technology
has been evolving over time transitioning from pencil beam (Lunar DPXL) to fan
beam scanners (Lunar Prodigy and iDXA), followed by hardware and software
renovation (Blake, Harrison, & Adams, 2004; Gagnon, McLean, Hannan, &
Cupples, 2010). With several DXA manufacturers in the field, the GE Lunar
Prodigy is one of the most widely used models worldwide. More recently, GE
introduced the iDXA model, a modernized fan beam system with powerful X-ray
tubes, more detectors, and a higher resolution (Choi, Lee, Lim, & Chung,
2009; Hull et al., 2009). Current literature shows significant differences in
BMD assessments between manufacturers and densitometers despite high levels of
precision (Choi et al., 2010; Hind, Oldroyd & Truscott, 2010; Shepherd et
al., 2006). This could be an issue when upgrading DXA densitometers in
longitudinal or multicenter studies. The International Society of Densitometry
(ISCD) recommends performing cross-calibration at commonly measured anatomical
sites when changing hardware or systems to reduce systematic errors (Shuhart et
al., 2019).
The GE Lunar
Prodigy has been utilized in our research laboratory for over 10 years.
Recently, a GE Lunar iDXA was installed to replace the older unit. Therefore,
a group of college students were recruited and scanned at the lumbar spine and
dual femur sites to cross-calibrate between the two devices.
METHODS
Participants
Thirty healthy
participants, 20 to 30 years of age, completed the study. Exclusion criteria
were individuals who: 1) were currently smoking, 2) had any metal implants in
the body; 3) had fractures within the last 12 months; 4) took medications known
to affect bone metabolism (i.e. glucocorticoids, antidepressant medication,
etc.). In addition, pregnant women were excluded. The study was approved by
California State University San Bernardino (CSUSB) Institutional Review Board
(IRB-FY2019-20). The participant’s characteristics are shown in Table 1.
There were ten males and twenty females, and their ethnicity were as follows:
Asian (7), Black (4), and Hispanic (15).
Table 1
Participant Characteristics (n=30, Mean ±
SD)
|
Sex
|
Age
(years)
|
Height
(cm)
|
Weight
(kg)
|
|
Male (n=10)
|
23.7
± 1.9
|
171.9
± 6.7
|
81.8
± 11.4
|
|
Female (n=20)
|
23.1
± 1.9
|
161.8
± 6.1
|
64.9
± 1.3
|
Research Design
Two visits were
required for this study. During the first visit, participants signed a written
informed consent, filled out the Physical Activity Readiness Questionnaire
(PAR-Q), and the Health History Questionnaire (HHQ). If the participants met
the criteria for the study, they were scanned on the iDXA (GE Healthcare,
Madison, WI) (new scanner) followed by the Prodigy (GE Healthcare, Madison, WI)
(reference scanner) at common clinical sites for BMD measurements. Prior to
the scans, height and weight were measured using a portable stadiometer (Seca
213, Seca North America, Hamburg, Germany) and digital electric scale (Tania
BWB-800S, Tanita Corporation of America Inc., IL), respectively. During the
second visit, the same bone scans were repeated on the iDXA only.
Bone Mineral Density Measurements
All participants
were scanned at the lumbar spine (L1-L4) and dual femurs on the iDXA first and
then on the Prodigy. Standard positioning was conducted following the
manufacturer’s recommendation on both devices. Prior to DXA scans,
participants were asked to take off shoes, wear minimal clothing and remove all
metal. The participants were positioned supine on the table with their head
approximately 2-3 cm below the horizontal line at the top of the table. A foam
block was placed under their legs with knees bent at 60-90 degrees and the
scanner arm was adjusted to 2 finger widths below the navel. Participants then
held their arms upright so that the lumbar spine was scanned. Once the scan
was completed, the block was removed and the feet were placed onto each side of
the foot brace using the provided straps. The left leg was positioned straight
so that the left hip was scanned first and then the same procedure was
conducted with the right leg.
A quality assurance
test was performed at the beginning of each testing day prior to data
collection. EnCORE software version 17 for the iDXA and version 11 for the
Prodigy were used for analysis, respectively. The same licensed DXA technician
performed and analyzed all the scans. BMD Z-scores were used in this study
since it is reflective to the population of the participants. ISCD states that
Z-scores, not T-scores, are preferred for BMD reporting in females prior to
menopause and in males younger than age 50. A Z-score of -2.0 or lower is
defined as “below the expected range for age”, and a Z-score above -2.0 is “within the expected range for age” (Shepherd et al.,
2015). In addition, a precision assessment was performed in standard routine
following ISCD recommendation as this is a new device in our laboratory (Baim
et al., 2005; Hind et al., 2010; Shepherd et al., 2015). All participants were
scanned on the iDXA again at the lumbar spine and dual femurs during the second
visit within a week of their first visit.
Statistical Analysis
Data were
analyzed using SPSS version 24 (SPSS Inc., Chicago, IL). All descriptive data
were reported as mean ± standard deviation (SD). Paired sample t-tests and
correlation analyses were used to compare BMD values between iDXA and Prodigy.
Linear regression was used to establish calibration equations between the two
scanners based on the slope and intercept. Per the manufacturer’s instruction,
if the slope was not statistically significant, paired sample t-tests were
further used to determine if the intercept was equal to 0. If both the slope
and the intercept were not statistically significant, a calibration equation
was not needed. Bland-Altman analysis was used to reveal any agreement to
evaluate the bias in the devices. Low bone mass was determined using the BMD
Z-scores ≤ − 2 at lumbar spine, femoral neck, or total hip. The level of
significance was set at p ≤ 0.05.
Table 2
Comparison of BMD between Prodigy and
iDXA (n=30, Mean ± SD)
|
BMD (g/cm²)
|
Prodigy
|
iDXA
|
%
Diff
|
p
|
|
AP Spine L1-L4
|
1.26
± .15
|
1.27
± .15***
|
1.54%
|
.000
|
|
Left Femoral Neck
|
1.10
± .18
|
1.12
± .19**
|
1.28%
|
.002
|
|
Right Femoral Neck
|
1.12
± .18
|
1.14
± .19**
|
1.56%
|
.007
|
|
Left Total Hip
|
1.11
± .17
|
1.13
± .18***
|
1.38%
|
.000
|
|
Right Total Hip
|
1.12
± .17
|
1.14
± .18***
|
1.42%
|
.000
|
Notes. %Difference
= (iDXA - Prodigy)/Prodigy; ** p < 0.01, *** p
< 0.001 between iDXA and Prodigy
RESULTS
The in-vivo
precision (CV%) of iDXA for our population was determined in the study: 1.07%
in lumbar spine (L1-L4), 1.31% in left femoral neck, 1.20% in right femoral
neck, 0.97% in left total hip, and 0.81% in right total hip. The CV% was
within the minimum acceptable precision according to the ISCD Position Stand
(Shuhart et al., 2019).
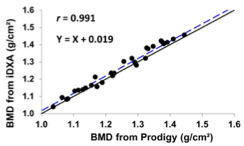
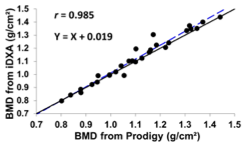
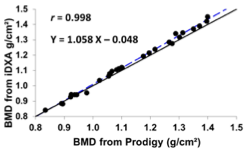
All participants
had normal BMD based on Z-scores. Strong correlations were found between all
BMD measurements in the two scanners (Figure 1) (r = 0.985 – 0.998).
However, the BMD values derived from the iDXA were significantly higher at all
measured sites compared to the Prodigy (p < 0.01) (Table 2.), ranging
from 1.28% to 1.54% at each site for the same participant.
Table 3
demonstrates the results of the linear regression. At the lumbar spine, left
femoral neck and right femoral neck, only the intercepts and not the slopes
were statistically significant (p < 0.01). Whereas at the left and
right total hip, both the slopes and intercepts were statistically significant
(p < 0.05). Calibration equations derived from linear regression
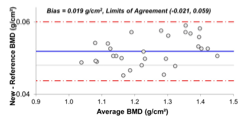
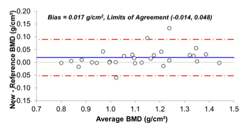
analysis were also reported in Figure 1. Additionally, a positive bias of 0.015
to 0.019 g/cm2 in BMD values were found in the iDXA as illustrated
in the Bland-Altman analysis in Figure 2. Limits of agreements (mean ± 1.96
SD) were also presented. Since there were no differences in BMD values between
the right and left side of the femoral neck and total hip, only the right side
was shown in the figure.
DISCUSSION
In our present
study, the iDXA had significantly higher BMD values than Prodigy at all
measured sites despite strong correlations between the two devices. This holds
true for several other studies. Saarelainen et al. (2016) measured a cohort of
women (21-72 years old, n = 72) and reported that BMD values were significantly
higher in iDXA than Prodigy. Specifically, they found iDXA results were 1.5%
higher at the lumbar spine (L2–L4), 0.5% higher at the femoral neck, and 0.9%
higher at the total hip, which was greater than our results at lumbar spine but
lower at hips. Choi et al. (2009) scanned 100 Korean participants (66 women
and 34 men) and found iDXA to have a higher mean difference of 2.3% in lumbar
spine, 2.4% in femoral neck and 1.4% in total hip when compared to Prodigy,
which were greater in comparison to our findings. The discrepancy might be due
to their participants’ older age (average 50 yrs) and ethnicity (Asian only).
Similar to our results, Choi et al. (2009) and Krueger, Vallarta-Ast,
Checovich, Gemar, and Binkley (2012) both found a high level of
agreement (r2 ≥ 0.98) in lumbar spine and dual femurs BMD
measurements between the iDXA and Prodigy in a large cohort of participants
(202 women and 143 men).
However, some
other studies have reported that GE iDXA BMD values were lower than Prodigy BMD
values at the total hip (ranging from −0.1% to −0.2%), femoral neck (ranging
from −0.7% to −2.0%), and lumbar spine (ranging from −0.25% to −1.2%) (Hind,
Cooper, Oldroyd, Davies, & Rhodes, 2015; Hull et al., 2009). Hull et al.
(2009) reported a total body BMD mean difference of −0.0197 g/cm2 in
males (n = 47) and −0.0403 g/cm2 in females (n = 52)
between iDXA and Prodigy in a group aged 18 to 81 years old. To the contrary,
we found that the BMD mean values of iDXA were 0.015 to 0.019 g/cm2 higher
than the Prodigy. It is necessary to note that our study measured and examined
all five common clinical sites as oppose to analyzing the total body BMD only.
Hind et al. (2015) found that the lumbar spine BMD (p < 0.05) and
femoral neck BMD (p < 0.01) were significantly lower in iDXA than the
Prodigy. Interestingly, total hip BMD values between the two densitometers had
no significant difference in their cohort.
According to the
ISCD, cross-calibration between devices is essential as the mean systematic differences
between instruments may exceed the annual biological BMD changes (Shepherd et
al., 2015). Differences of below 1% have been typically observed in past
studies between similar and different instruments from the same manufacturer
(Blake et al., 2004; Shepherd et al., 2008). In our study, we observed a
1.28-1.58% difference between the densitometers. Greater percent differences
may be attributed by the greater average BMD values obtained from individuals,
the younger age of our participants, and the implementation of an upgraded
software in GE iDXA.
Limitations of
this present study may lead to differences in results of previous studies. A
wide range of BMD values would be ideal for cross-calibration; however, all the
participants are healthy young adults who had a smaller range of BMD values
(Shuhart et al., 2019). Sex also plays a role as we see differences in past
studies that examined cross calibration of the spine and hip (Ganda, Nguyen,
& Pockock, 2014; Krueger et al., 2012). In one study, separate calibration
equations for total bone mineral content between the GE iDXA and Prodigy were
derived for female and male participants (Hull et al., 2009). However, The
ICSD position stand does not state any comment whether gender should be
implemented during cross-calibration studies (Shepherd et al., 2015; Shuhart et
al., 2019). As anthropometrical parameters and BMD values differ between
ethnicities (Ishii et al., 2011; Liang et al., 2007; Makovey et al., 2005), calibration
equations of multiethnic participants were not employed in this study.
Furthermore, the difference in software programs between scanners (enCORE
version 11 versus version 17) should also be noted as the radiation detection
and resolution of the iDXA is superior to the Prodigy. Lastly, body
composition could potentially influence BMD measurements. Blake et al. (2004)
found that 40% of the variance between the Prodigy and DPX-L spine BMD was
explained by systematic errors associated with patient body weight and the
difference in soft tissue composition measured on the two systems. A further
analysis on the effects of age, sex, and body composition on BMD between the
two scanners is needed in the future.
CONCLUSION
The GE Lunar
iDXA had significantly higher BMD values than the Prodigy at all measured sites
in healthy young adults. Cross-calibration equations should be implemented to
examine data across densitometers to reduce system differences in longitudinal
or multicenter studies.
ACKNOWLEDGMENTS
N/A
FUNDING
No funding declared to complete
this research.
REFERENCES
Baim, S., Wilson,
C. R., Lewiecki, E. M., Luckey, M. M., Downs, R. W., & Lentle, B. C.
(2005). Precision assessment and radiation safety for dual-energy x-ray
absorptiometry. Journal of Clinical Densitometry, 8(4),
371–378.
https://doi.org/10.1385/jcd:8:4:371
Blake, G. M.,
Harrison, E. J., & Adams, J. E. (2004). Dual X-ray absorptiometry:
Cross-calibration of a new fan-beam system. Calcified Tissue
International, 75(1), 7–14. https://doi.org/10.1007/s00223-004-0169-y
Choi, Y. J., Lee,
B. J., Lim, H. C., & Chung, Y. S. (2009). Cross-calibration of iDXA and
Prodigy on spine and femur scans in Korean adults. Journal of Clinical
Densitometry, 12(4), 450–455. https://doi.org/10.1016/j.jocd.2009.08.001
Choi, D., Kim, D.
Y., Han, C. S., Kim, S., Bok, H. S., Huh, W., … Hong, S. H. (2010).
Measurements of bone mineral density in the lumbar spine and proximal femur
using lunar prodigy and the new pencil-beam dual-energy X-ray
absorptiometry. Skeletal Radiology, 39(11), 1109–1116. https://doi.org/10.1007/s00256-009-0828-1
Gagnon, D. R.,
McLean, R. R., Hannan, M. T., Cupples, L. A., Hogan, M., & Kiel, D. P.
(2010). Cross-calibration and comparison of variability in two bone
densitometers in a research setting: The Framingham experience. Journal
of Clinical Densitometry, 13(2), 210–218. https://doi.org/10.1016/j.jocd.2010.01.003
Ganda, K.,
Nguyen, T. V., & Pocock, N. (2014). Gender disparity in BMD conversion: a
comparison between Lunar and Hologic densitometers. Archives of
Osteoporosis, 9(1), 1–5. https://doi.org/10.1007/s11657-014-0180-5
Heaney, R. P.,
Abrams, S., Dawson-Hughes, B., Looker, A., Marcus, R., Matkovic, V., &
Weaver, C. (2001). Peak bone mass. Osteoporosis International, 11(12),
985–1009. https://doi.org/10.1007/s001980070020
Hendrickx, G.,
Boudin E., & Van Hul W. (2015). A look behind the scenes: the risk and
pathogenesis of primary osteoporosis. Nature Reviews Rheumatology,,
11(8): 462-474. https://doi.org/10.1038/nrrheum.2015.48
Hind, K.,
Oldroyd, B., & Truscott, J. G. (2010). In vivo precision of the GE Lunar
iDXA densitometer for the measurement of total-body, lumbar spine, and femoral
bone mineral density in adults. Journal of Clinical Densitometry, 13(4),
413–417. https://doi.org/10.1016/j.jocd.2010.06.002
Hind, K., Cooper,
W., Oldroyd, B., Davies, A., & Rhodes, L. (2015). A cross-calibration study
of the GE-Lunar iDXA and Prodigy for the assessment of lumbar spine and total
hip bone parameters via three statistical methods. Journal of Clinical
Densitometry, 18(1), 86–92. https://doi.org/10.1016/j.jocd.2013.09.011
Hull, H., He, Q.,
Thornton, J., Javed, F., Allen, L., Wang, J., … Gallagher, D. (2009). iDXA,
Prodigy, and DPXL dual-energy x-ray absorptiometry whole-body scans: A
cross-calibration study. Journal of Clinical Densitometry, 12(1),
95–102. https://doi.org/10.1016/j.jocd.2008.09.004
Ishii, S.,
Cauley, J. A., Greendale, G. A., Danielson, M. E., Safaei Nili, N., & Karlamangla,
A. (2011). Ethnic differences in composite indices of femoral neck
strength. Osteoporosis International, 23(4), 1381–1390.
https://doi.org/10.1007/s00198-011-1723-x
Kanis, J. A.,
Johnell, O., Oden, A., Jonsson, B., De Laet, C., & Dawson, A. (2000). Risk
of hip fracture according to the World Health Organization criteria for
osteopenia and osteoporosis. Bone, 27(5), 585–590. https://doi.org/10.1016/s8756-3282(00)00381-1
Kanis, J. A.,
Hans, D., Cooper, C., Baim, S., Bilezikian, J. P., Binkley, … McCloskey, E. V.
(2011). Interpretation and use of FRAX in clinical practice. Osteoporosis
International, 22(9), 2395–2411. https://doi.org/10.1007/s00198-011-1713-z
Krueger, D.,
Vallarta-Ast, N., Checovich, M., Gemar, D., & Binkley, N. (2012). BMD
measurement and precision: A comparison of GE Lunar Prodigy and iDXA
densitometers. Journal of Clinical Densitometry, 15(1),
21–25. https://doi.org/10.1016/j.jocd.2011.08.003
Liang, M. T. C.,
Bassin, S., Dutto, D., Braun, W., Wong, N., Pontello, A. M., … Arnaud, S. B.
(2007). Bone mineral density and leg muscle strength in young Caucasian,
Hispanic, and Asian women. Journal of Clinical Densitometry, 10(2),
157–164. https://doi.org/10.1016/j.jocd.2006.12.005
Makovey, J.,
Naganathan, V., & Sambrook, P. (2005). Gender differences in relationships
between body composition components, their distribution and bone mineral
density: a cross-sectional opposite sex twin study. Osteoporosis
International, 16(12), 1495–1505. https://doi.org/10.1007/s00198-005-1841-4
Marshall, D.,
Johnell, O., & Wedel, H. (1996). Meta-analysis of how well measures of bone
mineral density predict occurrence of osteoporotic fractures. The BMJ, 312(7041),
1254–1259. https://doi.org/10.1136/bmj.312.7041.1254
Saarelainen, J.,
Hakulinen, M., Rikkonen, T., Kröger, H., Tuppurainen, M., Koivumaa-Honkanen,
H., ... & Jurvelin, J. S. (2016). Cross-calibration of GE healthcare lunar
prodigy and iDXA dual-energy X-ray densitometers for bone mineral
measurements. Journal of Osteoporosis, 2016, Article ID 1424582. http://dx.doi.org/10.1155/2016/1424582
Shepherd, J. A.,
Fan, B., Lu, Y., Lewiecki, E. M., Miller, P., & Genant, H. K. (2006).
Comparison of BMD precision for Prodigy and Delphi spine and femur scans. Osteoporosis
International, 17(9), 1303–1308. https://doi.org/10.1007/s00198-006-0127-9
Shepherd, J. A.,
Morgan, S. L., & Lu, Y. (2008). Comparing BMD results between two similar
DXA systems using the generalized least significant change. Journal of
Clinical Densitometry, 11(2), 237–242. https://doi.org/10.1016/j.jocd.2008.02.001
Shepherd, J. A.,
Schousboe, J. T., Broy, S. B., Engelke, K., & Leslie, W. D. (2015).
Executive summary of the 2015 ISCD position development conference on advanced
measures from DXA and QCT: Fracture prediction beyond BMD. Journal of
Clinical Densitometry, 18(3), 274–286. https://doi.org/10.1016/j.jocd.2015.06.013
Shuhart, C. R.,
Yeap, S. S., Anderson, P. A., Jankowski, L. G., Lewiecki, E. M., Morse, …
Shepherd, J. A. (2019). Executive summary of the 2019 ISCD position development
conference on monitoring treatment, DXA cross-calibration and least significant
change, spinal cord injury, peri-prosthetic and orthopedic bone health,
transgender medicine, and pediatrics. Journal of Clinical Densitometry, 22(4),
453–471. https://doi.org/10.1016/j.jocd.2019.07.001
World Health
Organization. (2004, May). WHO scientific group on the assessment of
osteoporosis at the primary health care level. Retrieved from https://www.who.int/chp/topics/Osteoporosis.pdf
Zhu, K., Briffa,
K., Smith, A., Mountain, J., Briggs, A. M., Lye, S., … Walsh, J. P. (2014).
Gender differences in the relationships between lean body mass, fat mass and
peak bone mass in young adults. Osteoporosis International, 25(5),
1563–1570. https://doi.org/10.1007/s00198-014-2665-x
*Address
correspondence to:
Erick Ramirez
Email: 004591157@coyote.csusb.edu
Zhaojing Chen,
Ph.D.
Email: Zhaojing.Chen@csusb.edu